Week 10. Nutrition Facts Labels and Conventional Dietary Structure: Perceptions and Ignorance, Pitting The Experts vs The People
Featuring One Man’s Sports Nutrition Story
Read these two articles before class:
Fueling the Modern Athlete (One Man’s Sports Nutrition Story)
Secret Foods of Athletes: Inside the Olympic Training Center’s Nutrition Lab
Week 5: Dietary Structure
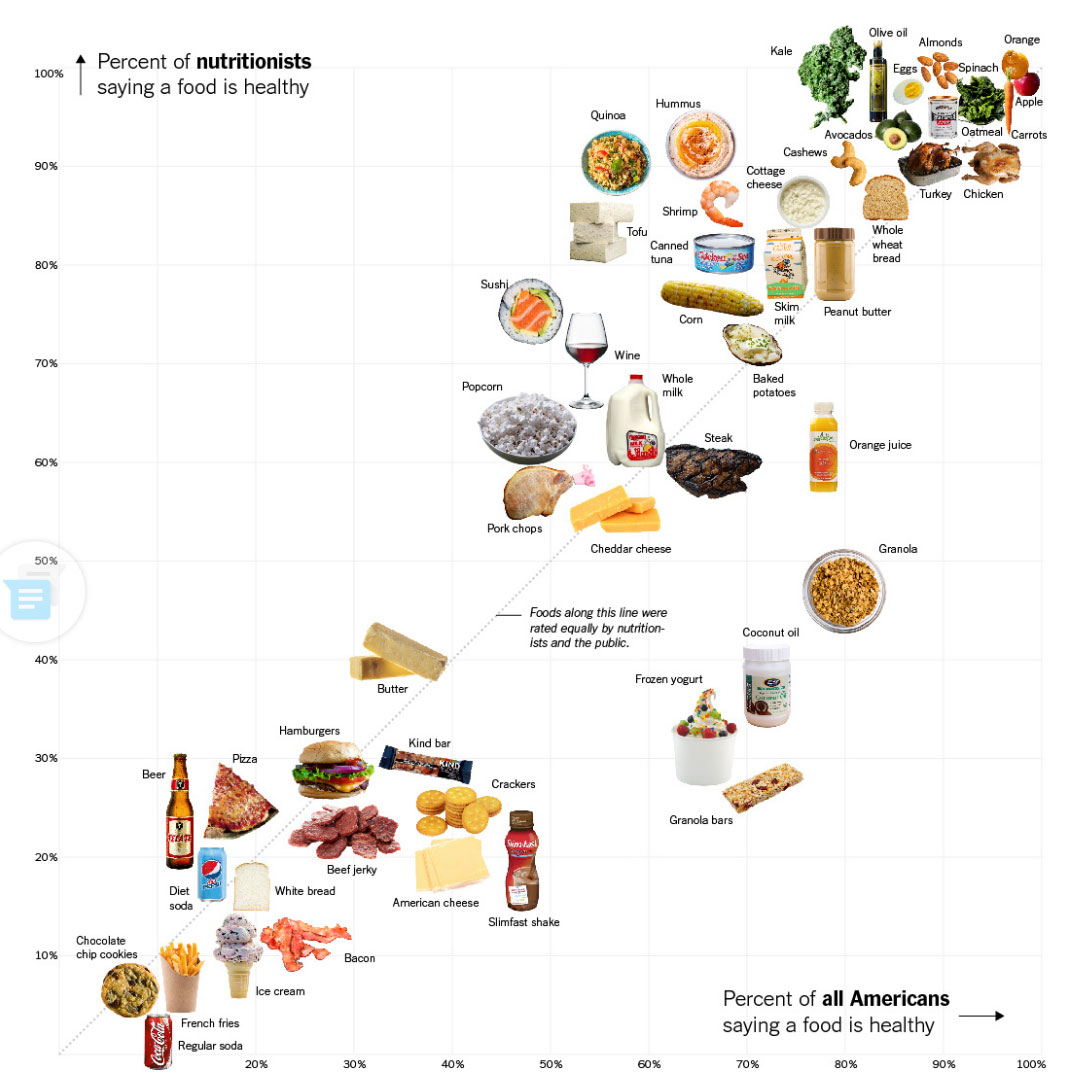
This infographic compares the rating of foods by experts to American citizens’ ratings in terms of the percentage of each group to judge the food ‘healthy’ or ‘unhealthy’.
The structure of the graphic reflects people’s thoughts. More specifically, you see how people perceive the same foods differently.
It appeared in this New York Times article July 5, 2016
One of the main objectives of this lecture is learning the conventional dietary structure, which is followed largely by the very experts and unwitting citizens who have judged the ‘healthiness’ of foods on the infographic.
- Conventional structure refers to the daily recommended intake (DRI of calories) for each macronutrient: carbohydrates, fat, and protein.
This infographic serves as a perfect specimen to critique conventional ‘healthy vs unhealthy’ foods and dietary structure as conceived and promulgated by conventionally trained dieticians and nutritionists – and additionally serves for exploring peoples’ perception and inconsistencies – or I should say peoples’ consistency of rating certain foods more healthy (or less so) differently from one another.
To make this critique interesting, we’ll use the numbers from a Kind Bar’s Nutrition Facts to obtain the DRI for carbs, fat, and protein. This can be done using ANY product label.
To make this critique interesting, we’ll use the numbers from a Kind Bar’s Nutrition Facts to obtain the DRI for carbs, fat, and protein. This can be done using ANY product label.
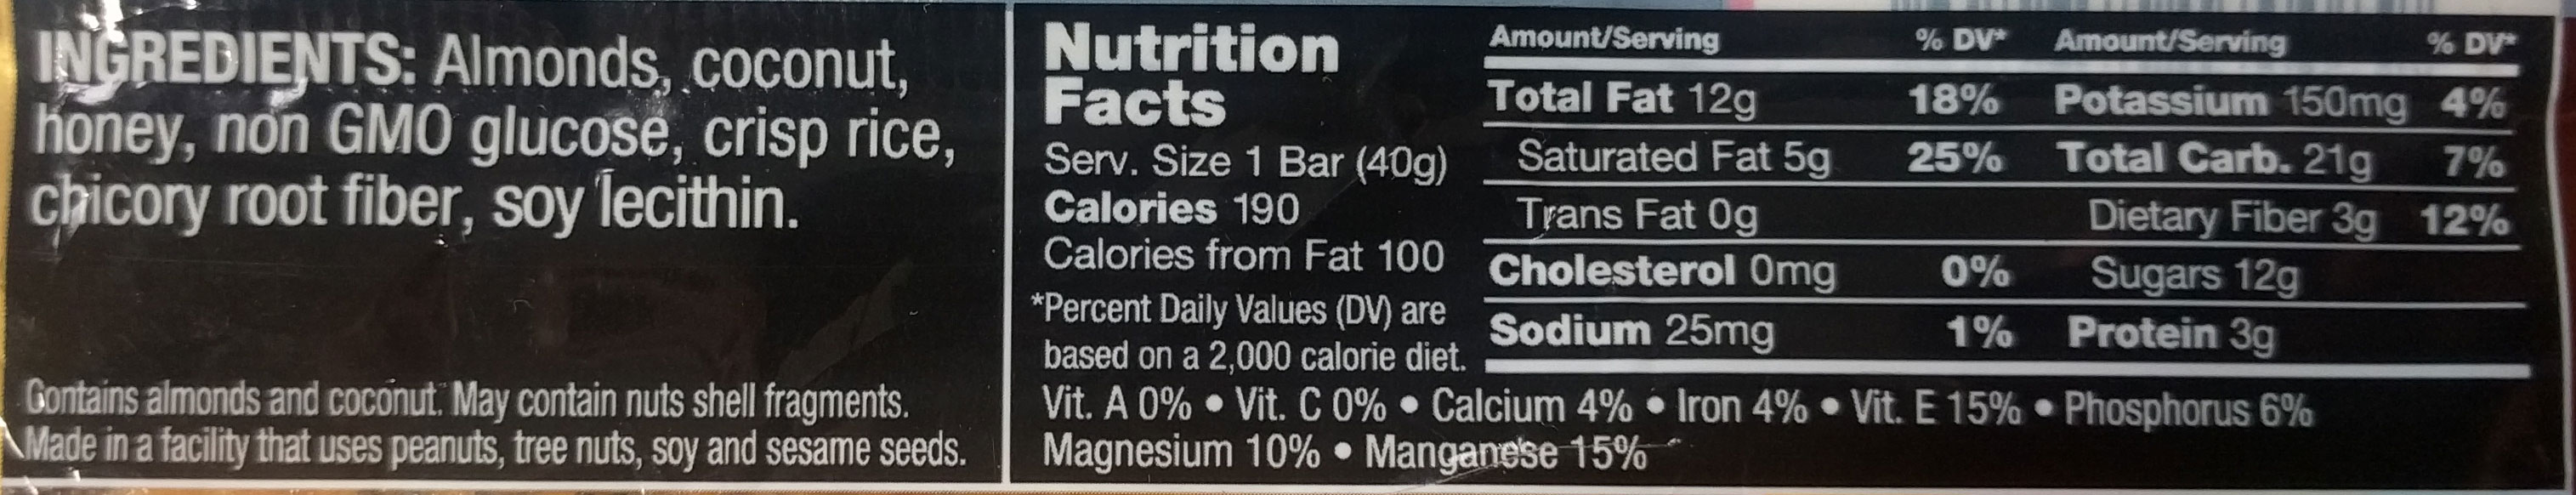
I picked the Kind Bar because it is also listed on the infographic. So not only do we use it to calculate DRI, but to explore perception and ignorance of fats and oils that are rated differently on the graphic.
After crunching the numbers from the label above we’ll compare the DRI numbers of the ‘conventional structure’ to the functional based figures we came up with last week.
However, before we crunch any numbers and make comparisons I introduce you to a specific knowledge required to understand fat.
This knowledge – in the graphic below – is shown as the fatty acid profile of olive oil, lard, and corn oil.
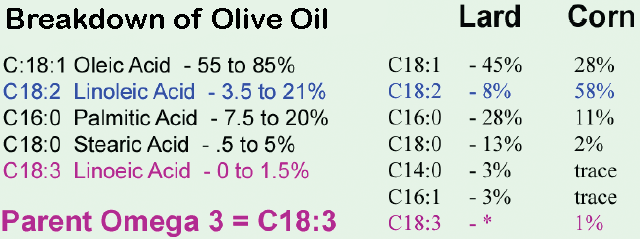
A basic understanding of fatty acid profiles of fats and oils reveals why even expert nutritionists misunderstand fat and explains the reasons why the ‘health rating’ for certain foods on the infographic can be reinterpreted completely. I’ll show you this first in Section 1.
Section 2 uses knowledge you learned in week 1 to explain one reason a hamburger should be placed in a ‘more healthy’ position.
In Section 3 we crunch the numbers of the Kind Bar using its Nutrition Facts label and also analyze a hamburger to accurately see the percentage of the daily recommended intake of fat it provides. Thus, you’ll see another reason the burger should placed in a more healthy position.
- But it is the Kind Bar calculation that gives us the DRI’s for carbs, protein, and fat, which we then use for comparing conventional dietary structure to a functional based way of eating.
In addition to the above we discuss Olympic athletes’ nutritional problems, successful practices, and shortcomings – with color commentary and greater perspective provided by one man’s sports nutrition story on his competition-based habits – from his past body building and Iron Man Triathlon days to his current regimen.
Read these two articles before class:
Secret Foods of Athletes: Inside the Olympic Training Center’s Nutrition Lab
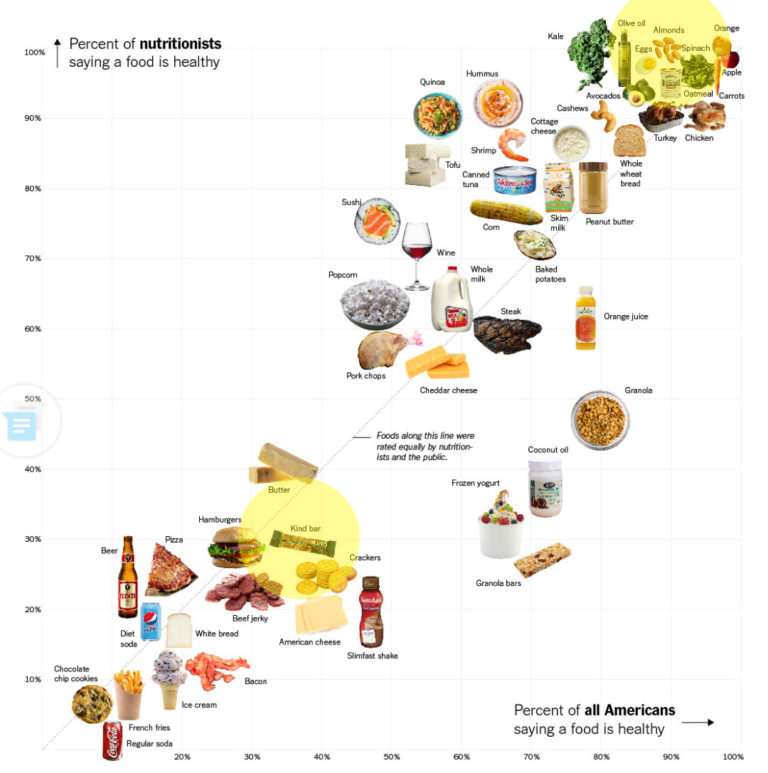
If a Kind Bar is placed in a relatively unhealthy position then any similar food made of the ‘same stuff/fatty acids’ should be placed in close proximity to the Kind Bar. But this is not the case with the Kind Bar and almonds – each highlighted in yellow. The misplacement of certain foods, e.g. almonds, coconut oil, bacon, olive oil, is due to ignorance of the structural components of these foods – ignorance of the individual fatty acids that make the whole food. Read the caption above before you read this sentence below: If people are ignorant of the fatty acids that make up fats, oils, nuts, avocados, dairy fat, etc, then foods like Kind Bars, olives, hamburgers, lard, cream on top yogurt, etcetera, will be categorized and placed in a layout not consistent with their actual makeup and function. Thus, the foods appear in randomized ‘more healthy’ (or less so) positions; foods are not placed close together like they should be wihtin a ‘like grouping’. So, a short course in fatty acids goes like this: Therefore, if foods are made of the same or mostly same type and number of fatty acids, they should be placed in the same proximity on the infographic. Sounds stupid? It is indeed only if you are not ignorant and know better. But if you’re in a profession to teach language or nutrition, teaching the wrong way is worse than useless because later it must be unlearned. Because oleic acid is the primary fatty acid of olive oil and lard (bacon fat) – we have an irrefutable precedent for which both should be perceived as similar foods/fat sources and be placed much closer to each other on the graph. I get it; other stuff comes into play, but the topic is fatty acids. Like I said, there is a specific knowledge absolutely required to understand fat more completely. It begins by knowing fatty acids make fat just as letters make words. We’ll examine the fatty acid profiles of fats and oils in detail later. Next we look at the burger and see how what you learned in week 1 is a valid explaining just one of a few reasons a hamburger should be placed in a ‘more healthy’ position.
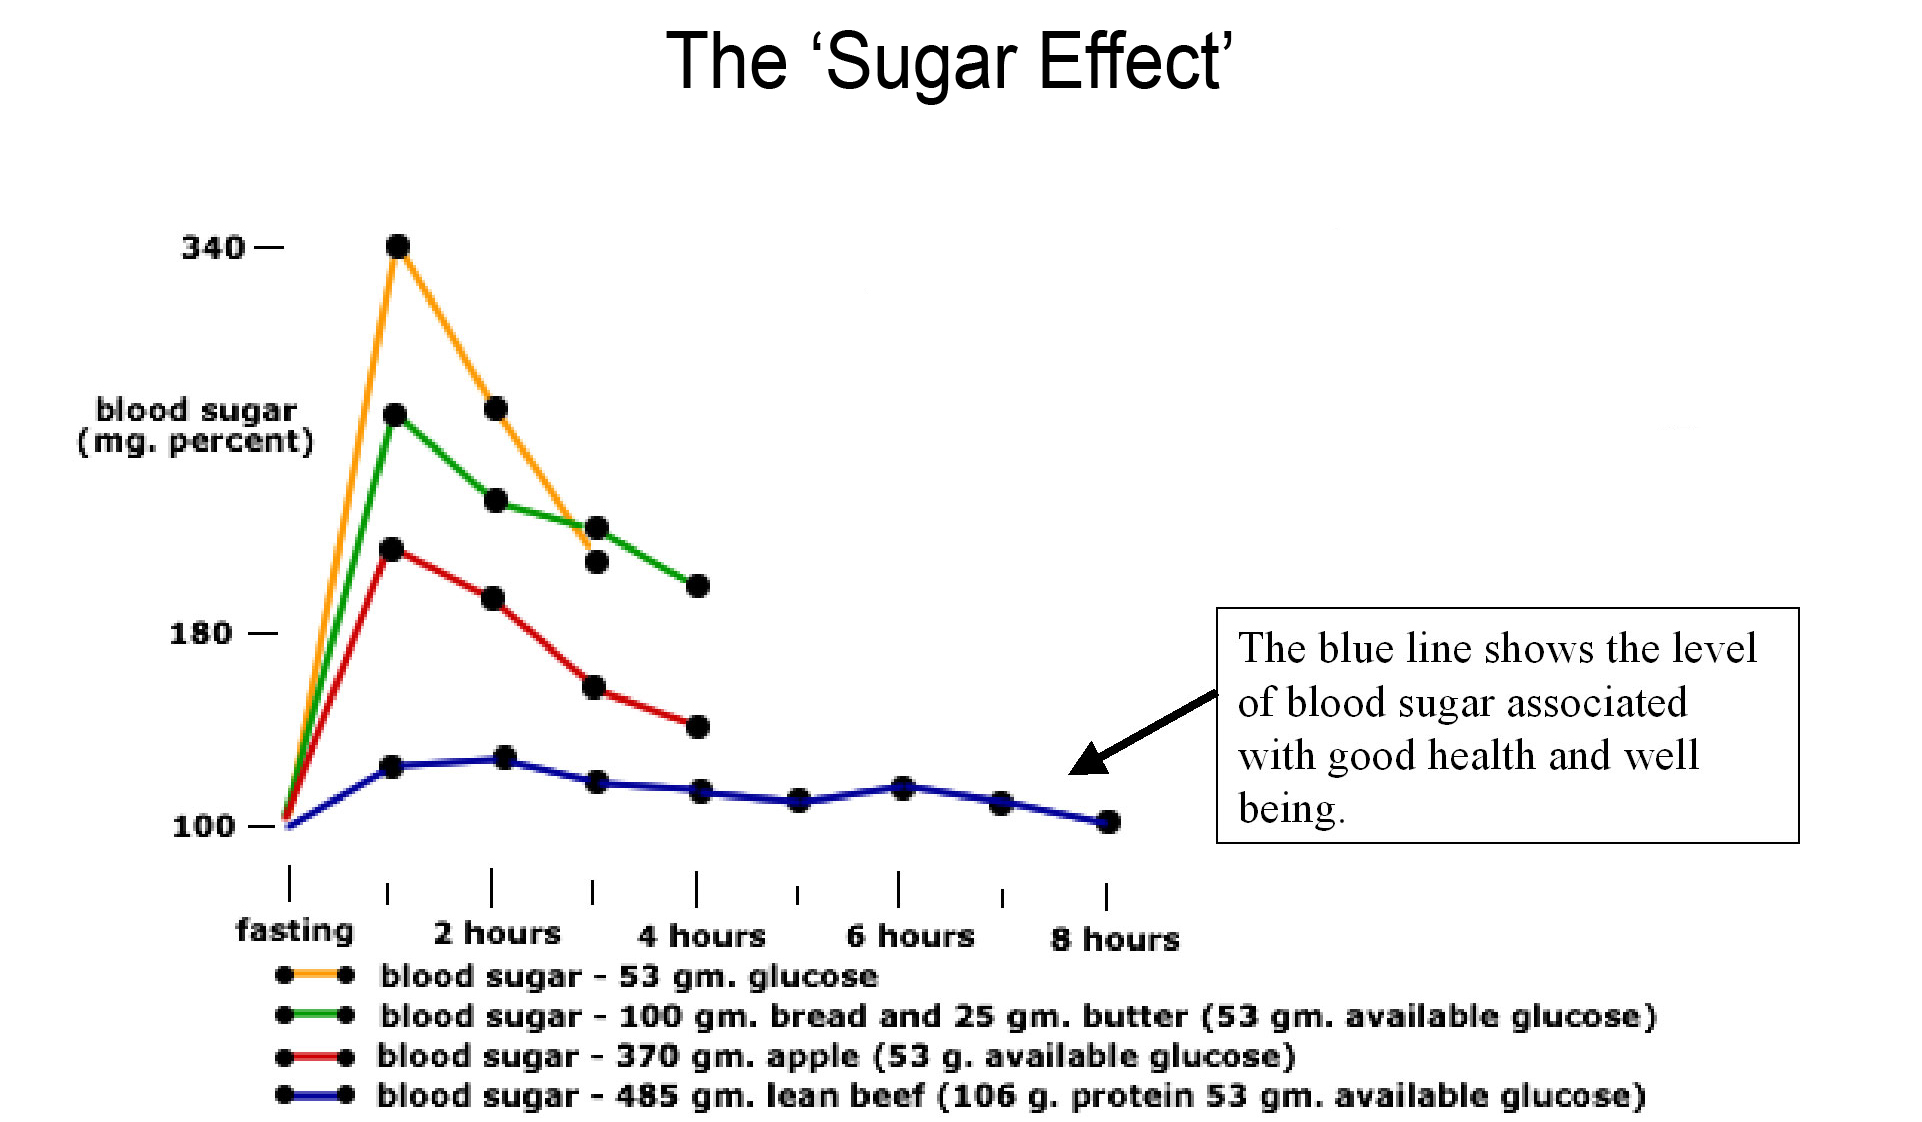
In week one you saw how the rate of glucose absorption gets ‘flat-lined’ by ingesting it with beef. Just as beef slows glucose absorption, it also slows down the absorption of glucose from the bun – nullifying the idea the bun’s refined carb content is ‘bad’ in terms that it would spike blood sugar. Case closed. (discussion in class/seminars may ensue) Just as beef slows glucose absorption, it also slows down the absorption of glucose from the bun – nullifying the idea the bun is ‘bad’ in terms that it would spike blood sugar. Case closed. (discussion in class/seminars may ensue) In Section 3 you’ll see another reason the burger should not be placed where it is on the infographic in terms of the amount of fat. Later, we’ll examine the fatty acid profile of beef – which reveals a third reason for rating a hamburger ‘more healthy’ and clarifies perception regarding saturated fatty acids. Case open.
Getting the DRI for fat is shown on the image below: click to enlarge. The whole bar is one serving. Using ANY food label you will get 300g by dividing the total carb count by the %DV. You MUST get the same result because DRI for carbs is 300g. We could ‘Google’ it or we could calculate it. I’ll do both ways; the two numbers should be practically equal if my calculations are correct. Googling the key words “Protein Daily Recommended Intake” – gives us the DRI for protein below: First, convert the DRI gram counts for carbs (300) and fat (66.6) to calories: Carbs 300g / Protein 50g = 6/1 ratio The conventional structure recommends ingesting the amount of carbs equal to the an elite cyclist’s requirement, for riding 1 hour very intensely. Keep in mind, 294g of carbs is the daily intake that suffices to restock glycogen stores in a cyclist. There’s no way an average person requires this many carbs. Clearly, the conventional 6/1 (300/51) ratio is ridiculously high. 6/1 is a recipe for weight gain and/or diabetes, especially for sedentary people. It is also extremely doubtful the elite male cyclist would eat the DRI of only 56g of protein a day, since it would be a recipe for structural breakdown and degeneration due to the physical stress. Let’s see what a carb/protein ratio is with the increased protein intake. I used the 294g of carbs needed for glycogen replenishment, which gives a 3/1 carb/protein ratio. Click to see how much fat an 80% lean, 1/4 lb chunk of beef supplies. It equals 13.5 grams, which is almost equal to a tablespoon of olive oil. Now divide 13.5g by 66.6g to see the percentage of the daily recommended intake a hamburger provides. This means you could eat 5 hamburgers and NOT exceed the total gram count of ‘daily recommended intake’ of fat. Do you see the exaggeration and mistaken belief that a burger is a high fat meal? Case closed. By the way, the DRI for fat at 66.6 grams and 30% of total calories is NOT a line you’re not supposed to cross. You’ll often see these words: Do not exceed 30% of total calories from fat. It is an arbitrarily set limit, which actually will provide too little fat – as shown in the next section.
What is total fat intake when it is 30% of total daily calories and when it 40% calories? I’ll calculate this for a person who exercises moderately intensely for 1 hour/day. As a reminder, the ‘exercise-lifestyle’ features of this structure are: Assume a 70kg or 154lb lean man. We need to know his carb and protein intake first. 162g carbs are needed to replace glycogen. Again, I used week 4’s info: 111g protein is derived from ‘the practical method’ – i.e. eat a 2/1 ratio of Carbs/Protein, which means carbs are double that of protein. Now we’re ready to see what 30% and 40% of fat calories come to in terms of grams. Then we compare these figures to the “conventional 66.6” grams – or DRI. This means total calories from carbs and protein represent 70% of total calories. We want to see how many grams the 30% of calories from fat equate to. First, we need to know the total calories for the day from all three macronurients. Divide the calories from carbs and protein by .7 Subtract 1092 from 1560 gives us the total calories from fat. Apply critical thinking and discussion. Next I’ll calculate the same for 40% Calories from carbs and protein remain the same as before at 1092 calories, but more fat is needed and so will represent 40% of total calories. This means carbs and fat now provide 60% of the total calories. (fat is 40%). A much shorter derivation below: That’s more like it! 81 grams of fat per day – at 40% of total calories – now exceeds the arbitrary 30% limit (66.6g) of total calories from fat. Under this scenario: Here’s the breakdown of the dietary structure for a person who exercises moderately intensely:
1. Introduction to Misclassification of Fat
Here’s an example to wrap this up until more detailed study in a later lecture:
2. One Reason why a Hamburger Should be Placed in a “More Healthy” Position
3. The Basic Structure of Food Labels
Now we use the numbers from a Kind Bar’s Nutrition Facts to obtain the DRI for carbs, fat, and protein. This can be done using ANY product label.
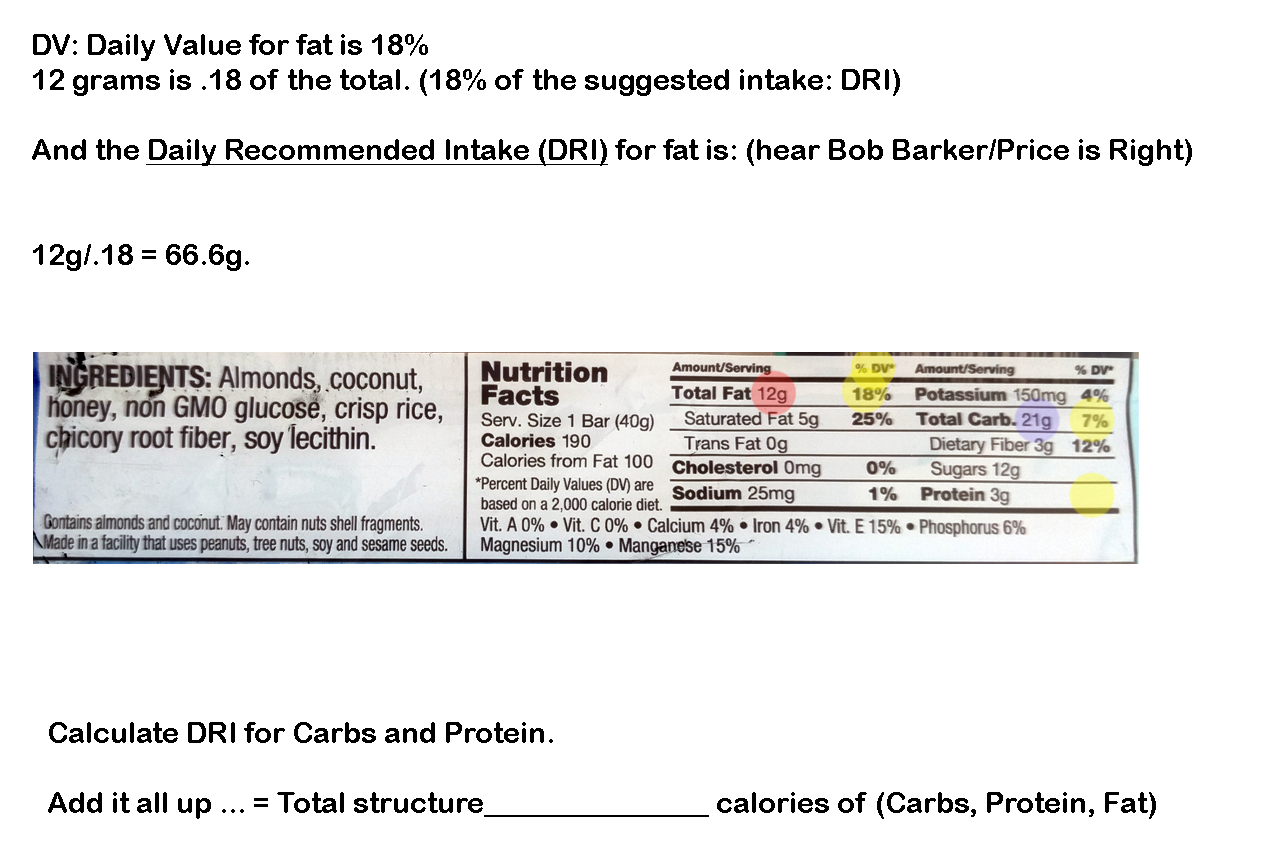
Calculate DRI for carbohydrate the same way I did for fat above in the image:
21g/.07 = 300 g
The percent DV for protein is often not listed on labels.
My calculation below absolutely better result in a number between 46 and 56 grams.
Conventional structure of a Nutrition Facts Label is based on TOTAL calories set at 2000 calories from carbs, protein, and fat.
This makes the DRI for protein to be 200 cals.
The final DRI figures for each macronutrient are:
So yes, my calculation of 50g is between 46 and 56.
The Ratio of Carbs to Protein is:
Now compare the 6/1 ratio and the DRI total of 300g carbs per day to the needs of ‘Fueling the ‘Modern Athlete’
Assume the cyclist-athlete who rides 1 hour intensely eats at least 100g of protein per day, not 56g.
The second reason why a burger should not be placed where it is on the infographic regarding its fat content:
13.5/66.6 = .20 or 20%.
4. Characteristics and Guidelines of the Conventional Structure
The question
Sum Carbs + Protein = 1092 calories
Fat: at 30% of total calories overall.
VERDICT of 30% of total calories from fat:
52 g per day is short of the DRI of 66.6 g.
Fat at 40% of total.
The Final Breakdown
Primary Concepts: Talking Points
1) Max Carb Intake is only necessary for:
a) Training near or at Maximum Lactate Steady States (MLSS)
b) People like hockey players who perform repetitive ‘sprint bursts’ (intervals) throughout an entire game or practice.
c) To compete, competitively period. As above in sports like cycling, rowing, long distance track events, etc.
2) From the pinnacle of Max Carb Intake, we ‘cut the carbs’ progressively.
This is a functional based carb intake specific to activity level or lifestyle for all humans.
4) Weight training or resistance exercise – reps/exhaustion style – is a form of interval training.
a) A 400m dash is similar to performing leg presses – from 15-20 reps to near failure.
b) Overall glycogen depletion can be moderately high to high when reps/exhaustion schemes are performed. (Glycogen depleting workouts).
5) Pure strength training – neural recruitment, heavy weight/low reps – does not deplete as much glycogen as reps/exhaustion training.
a) Dependent on mechanical efficiency, skill, and knowledge of self – a lower carb diet is ‘smart’ for staying lean and strong – as long as the focus is truly on neural recruitment.