The Physical Rules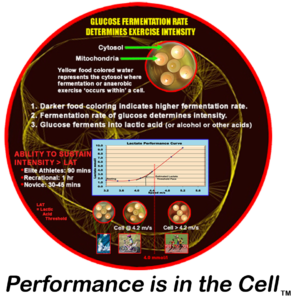
of the Heart, Blood Flow, and Cardiac Output
Week 3. Visualizing Cardiac Output and Blood Flow Physics
A) Physical Rules of Blood Flow and the Heart
1. When the left ventricle contracts it spins the blood into a whirlpool, creating a vacuum or low pressure vortex just before the aortic valve opens to let blood flow out to your body (imagine spinning wine in a wine glass).
Read: Refutation of the Pressure-Propulsion Theory
The heart does not push blood into the aorta per se’. Again, spinning a fluid creates negative pressure, then by vacuum blood is sucked (ejected) into the aorta at a speed up to 1 m/s indicated by the red swirling lines – for the Healthy Volunteer only – in the 4D MRI video below.
Patients A, B, and C have aortic aneurysms, shown by the wasted swirling of blood where the walls of the aorta have weakened and are about to burst and kill the person instantly at any moment – unless they receive an operation.


2. The heart does not create pressure – it creates flow. Here’s a correct conception of the physical rules of blood circulation.
Blood pressure is a measure of resistance within blood vessels… against flow. Thus hypertension, increased blood pressure or resistance is peripheral and downstream from the heart within blood vessels.
The heart’s purpose is not to resist flow; no pressure is created but flow is. Circulation is non-stop, thus the hearts assists momentum which is established as momentum/flow of liquid throughout the system, and therefore simply provides a boost to maintain momentum just as you would just slightly tap a child on swing set once already swinging.
Increased resistance to flow is often due to loss of arterial flexibility or pliability – i.e. hardening, calcification, or constriction of the arteries by smooth muscle.
Constriction and/or loss of vessel pliability narrows the diameter of arteries, which increases pressure/resistance against flow akin to a defensive linebacker impeding the flow of a running back by physically slowing him down or ‘worse’ yet, stopping progress altogether.
3. Related topics covered more specifically in other posts or lectures, which I may allude to or discuss in this lecture.
A. VO2 consumption at rest (or demand by your cells) should not, ideally, decrease significantly over time with ‘age’ – unless it’s decreased by degeneration or disease.
Striving to increase or having a high VO2 max is not a crucial health marker or badge of vigor or assured longevity, but maintaining your cells baseline, resting energetic state is. A strong idle – maintaining a youthful 1 MET – is crucial.
In other words, maintaining your cells metabolic mitochondrial capacity to utilize oxygen at rest and get fueled correctly is the more important marker for maintaining the life force. The heart responds to that demand.
B. Feeding the heart the specific fuel it needs to work keeps it responsive and strong. Avoiding excessive endurance exercise (mitochondrial depletion/damage) combined with proper nutrition is likely protective of both the heart’s energetic state (capacity to utilize fuel substrate). Additionally this ‘avoidance’ likely reduces chronic excessive mechanical stress of the walls of the coronary arteries, more on that in section D just below.
Post: Energy Starvation Model: Heart Failure and Specific Fuel Substrate Utilization
Discuss: Top Endurance Athletes Face Higher Risk of Arrhythmias and Arterial Plaque, Doug’s A-fib story: “A Very Bad Day – or – Lucky to Be Alive?“, Brian Leibovitz, Ph.D. article: Nutritional Treatment of Heart Disease.
C. ‘Tired’ or energetically deprived cells are worn out cells; worn out cells swell with water.
Ever hear of an enlarged heart? Energetic depletion explains why a person with heart failure has a swollen heart or people with overuse injuries suffer from ‘water swollen’ inflammation.
See this Ray Peat article and my illustrated piece on the Death of Jennifer Strange and electrophysiology.
Overtraining tires out your cells, like an engine worked too hard. A cell chronically worked too hard swells AND is in a chronic energy deficit.
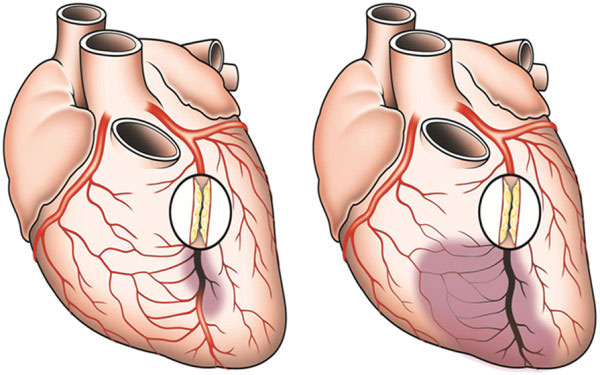
D. Avoiding excessive endurance exercise combined with proper nutrition likely reduces chronic excessive mechanical stress (structural damage) of the walls of the coronary arteries.
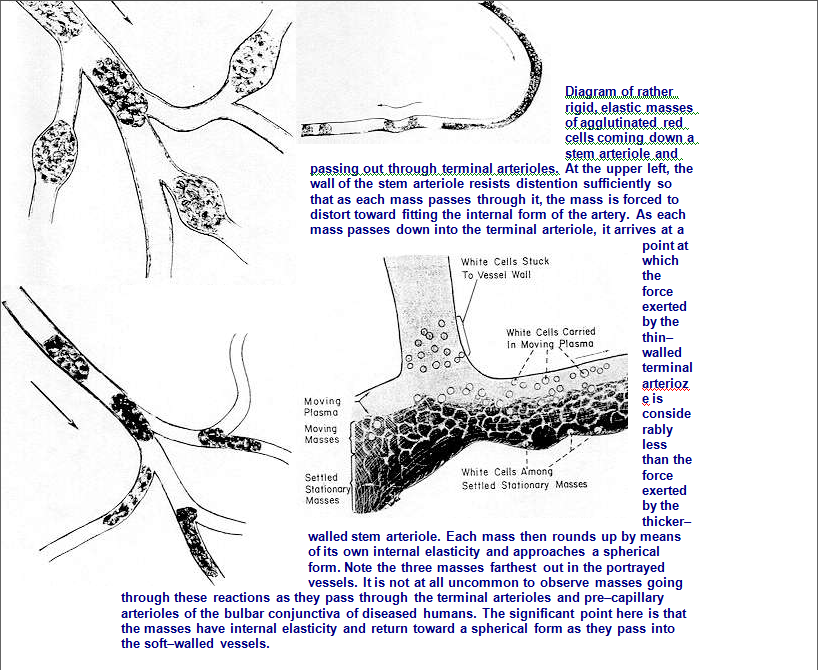
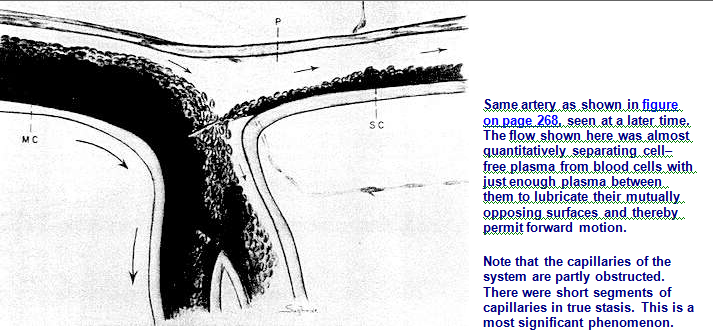
Discuss: Top Endurance Athletes Face Higher Risk Increased Arterial Plaque, Show Kummerow’s graph on lesions, calcium deposits, and peroxidation of PUFAs in coronary arteries, Riddick’s zeta potential material – images below.


Avoiding excessive ‘stretching’ of the heart and coronary tissue, which is concomitant with huge stroke volumes and sustained depletion of specific fuel substrates is likely protective – in my professional opinion. What defines excessive nobody knows, perhaps over 30 miles a week is my educated guess.
Coronary artery size and dilating capacity in ultradistance runners.
Assuming you read ‘Cardiology is Flow’ – you understand that basic precepts and terminology are absent in the lexicon of trained cardiologists, as stated by those authors – I wouldn’t hold your breath to wait for your run of the mill cardiologist to readily grasp the integration of these concepts. Keep connecting the dots.
E. Keeping your blood in a healthy colloidal state (zeta potential) maintains heart rhythm and allows for better better blood flow through the blood vessels, especially through the capillaries.
 in various fresh foods when struck by a hammer. This stuff relates to zeta potential of blood and formulating water for better kidney function, blood flow, and maintaining heart rhythm.")
B) Visualize Cardiac Output:
1. The volume of blood you see ejected after each heart beat in the ‘Healthy Volunteer’ is called Stroke Volume (SV). See the video again below.
Stroke volume may be as low as 60ml of liquid in a sedentary but healthy person or as high as 100ml in an elite endurance athlete.
2. The red oval in the drawing represents a wad of blood ejected from a single heart beat. This volume of blood ejected is stroke volume.
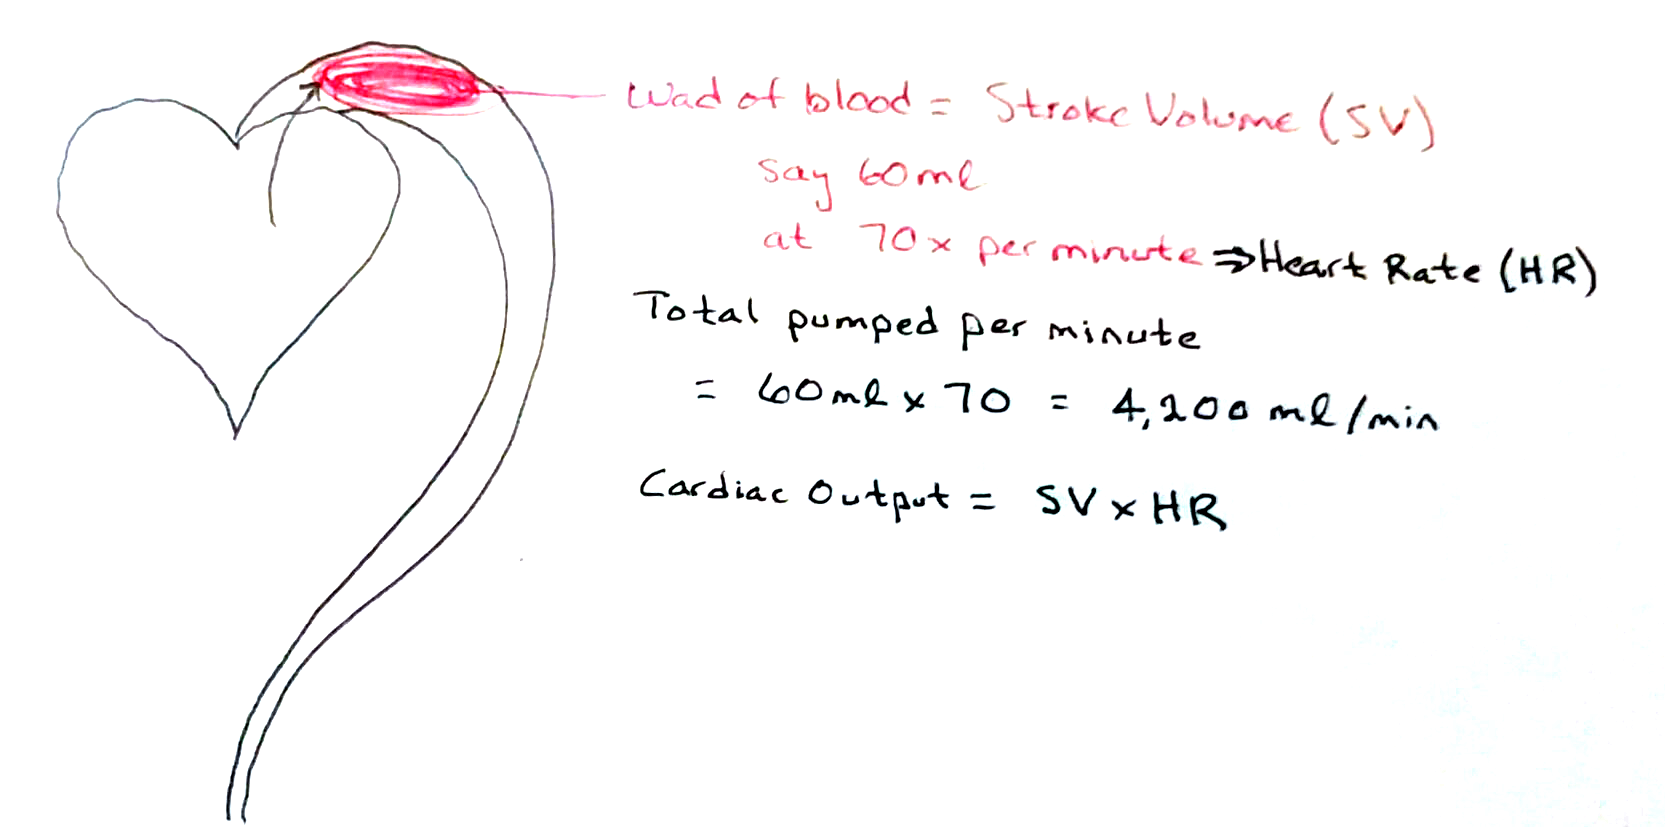
The total volume of blood pumped in 1 minute is 70 times the volume each 60ml blood wad. Each wad or stroke of blood pumped out is called Stroke Volume. (SV)
Cardiac Output = SV x Heart Rate (HR: beats per min or bpm)
thus:
6oml x 70 BPM = 4200 ml/min.
4200 ml/min represents a sedentary person’s cardiac output. We’ll compare this to an elite marathoner below.
Keep in mind, cardiac output is NOT the volume of blood ejected per beat but rather the total volume of blood pumped over time, specifically in one minute.
3. Compare an Elite Athlete’s Cardiac Output to a Sedentary Person’s
Now because stroke volume is higher in an athlete, it seems illogical at first to hear a healthy, sedentary person’s cardiac output is equal to an elite endurance athlete’s cardiac output when both are at rest. First, consider the prototypical adaptations to elite endurance athlete’s heart:
An elite marathoner’s stroke volume typically increases up to 100ml blood per beat – give or take 10 ml up or down.
An elite endurance athlete’s prototypical heart rate ranges around 40 BPM – give or take a few beats up or down.
Let’s see how the formula proves each person’s cardiac output is fairly equal, each close to 4200 ml/min.
Just plug in the two bold figures from the elite marathoner above into the equation:
Cardiac Output = SV x HR
100ml x 40 BPM = 4000 ml/min.
The endurance athlete’s cardiac output is a bit LESS than the sedentary person’s 4200 ml/min.
This indeed is completely expected and normal since elite marathoners are small people, often very light – such as world record holder Dennis Kimetto who weighs only 121 pounds or 55kg.
Smaller people like Kimetto simply consume slightly less of oxygen per minute at rest compared to significantly larger humans. (Relative VO2 is another story, as we saw in Week 13: Metabolism of Mice and Men, Birds and Elephants).
At any rate, a slightly less total blood output each minute is needed to supply the slightly lesser volume of oxygen demanded by a smaller body.
4. So why do endurance athletes heart rate slow down dramatically at rest compared to larger sedentary people?
Oxygen consumption in a particular species is fairly equal among all its members. In other words, oxygen consumption at rest in healthy trained or untrained humans is for practical purposes, essentially equal.
Of course elite marathoners utilize more oxygen while exercising – but ONLY at very high intensity levels approaching VO2 max (they have high VO2 maxes) but most everyone consumes roughly the same amount of oxygen at rest (1 MET) and during most any intensity level, or more specifically at virtually all sub-maximal intensity levels.
Click the gallery of graphs below – with explanatory captions – to see how this works.
Start with the upper left slide.
IMPORTANT! Tap or click the image to dismiss or recover the captions.


 but nevertheless, they can still run very fast speeds temporarily if strong and young. All it takes to perform a VO2 max test is to run, NOT as fast as possible, but past your lactate threshold, a bit faster and faster within a short time frame until your oxygen utilization maxes out. Thus, despite running at speeds faster than lactate threshold, we see the same VO2 usage in virtually all humans running the same speed.")


Takeaway message from the graphs:
1. The blood of an untrained human and an endurance athlete leaves the heart saturated with roughly 20ml O2 dissolved per 100ml blood. Thus, pumping a certain volume of blood is synonymous with providing a certain quantity of oxygen.
2. Since all humans consume the same amount of oxygen at any specific sub-maximal intensity – the same amount of blood gets delivered – which means cardiac output is the same. It doesn’t matter if one heart’s stroke volume is less than another heart; it will speed up in order to deliver the equivalent volume blood compared to the heart with a greater stroke volume – and by extension the same amount of oxygen is provided by both hearts.
Thus, a cardiac output graph and VO2 resemble each other – shown superimposed below:
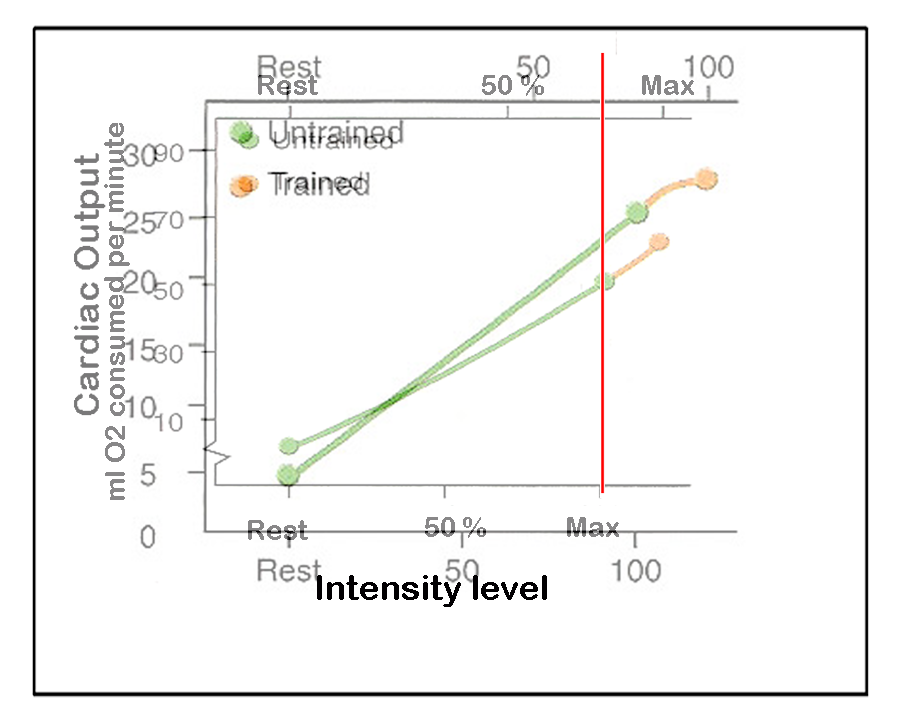
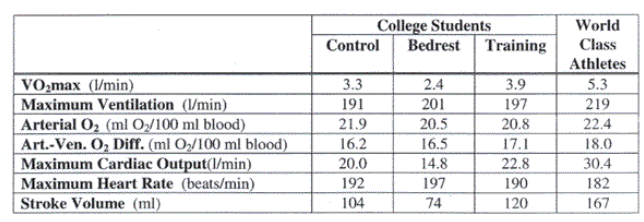
Even at MAXIMAL efforts, all the conditions imposed on the humans shown below result in roughly the same amount of Arterial O2 dissolved in blood as it leaves the heart. Keep in mind, the cardiac outputs and stroke volumes listed are max intensity, not sub-maximal values
5. Comparative calculations from an impossibly high stroke volume to that of a sedentary person:
If stroke volume of our sedentary person was ridiculously large enough – say a whopping 4,200 ml blood per beat – then the heart would need to beat only once per minute to deliver the oxygen required by the body per minute at rest!
If stroke volume is 2100 ml – then only 2 heart beats would be necessary to deliver 4200 ml per minute.
- HR = CO/SV –> 4200ml/min divided by 2100ml = 2 BPM
If SV is 1000 ml, then HR = 4200/1000 = 4.2 BPM
If SV = 100 ml, then HR = 4200/100 = 42 BPM
If SV = 60 ml, the HR = 4200/60 = 70 BPM
6. If oxygen consumption is fairly equal in all humans at rest (as shown in the gallery of graphs) this means all humans’ stroke volume, heart rate, and cardiac output should be fairly close to some average. Indeed this is the case:
Average stroke volume = 70 ml (at an avg HR of 70 BPM). thus…
Average cardiac output = 4,900 ml/min = 4.9 liters/min
Since total blood volume on average equals 5 liters, it takes about 1 minute for blood leaving the heart to return to the heart.
7. Summary
A trained human’s heart beats slower at rest simply because stroke volume is greater.
Oxygen consumption or demand by your cells at rest never decreases significantly over time with ‘age’ – unless it’s decreased by degeneration or disease. Thus, having a high VO2 max is not a crucial health marker or badge of assured longevity, but maintaining your cells baseline, resting energetic state is.
In other words, maintaining your cells metabolic mitochondrial capacity to utilize oxygen at rest and get fueled correctly is the more important marker for maintaining the life force. The heart responds to that demand.
8. Illustration
The difference between a couch potato’s and an elite athlete’s cardiac output and heart rate is illustrated below – in Edition 1 of The Physical Rules – but on pages 14 and 15 of the newest, 3rd edition.

C) Tapping Out the Full Potential of Your Aerobic Capacity is Limited by Lactate Threshold.
This section is explained again more fully next week in Week 4, Glycolysis Visualized.
1. As shown in the last section a sedentary person, a fairly fit person, and an elite athlete consume the same volume of oxygen at sub-maximal levels.
In terms of race performance an athlete may even have a higher VO2 max than a competitor, but this doesn’t mean he can run faster in a sprint or outrun his competitor in an endurance race.
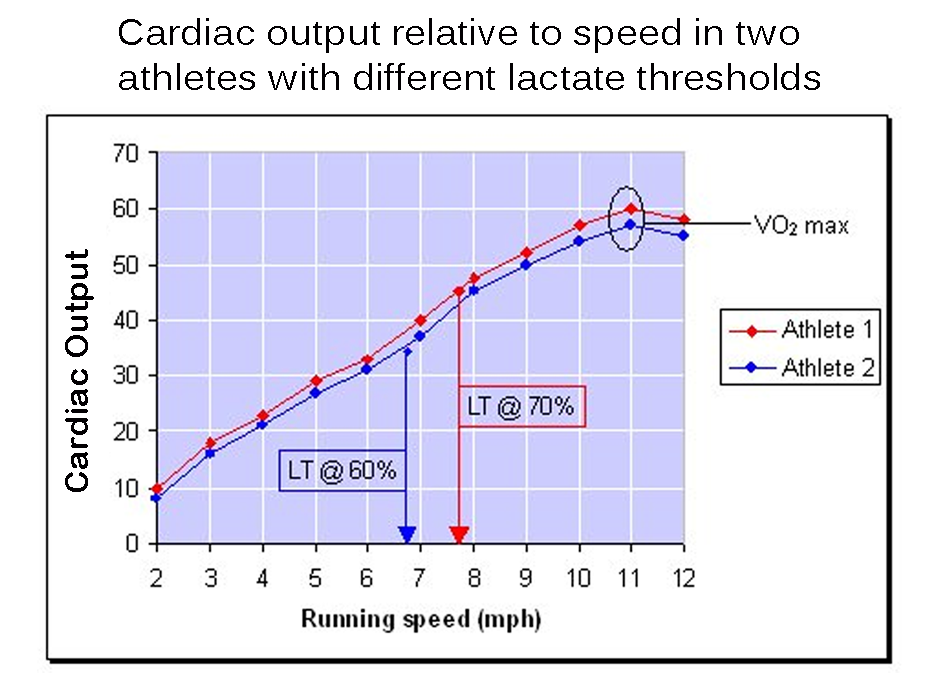
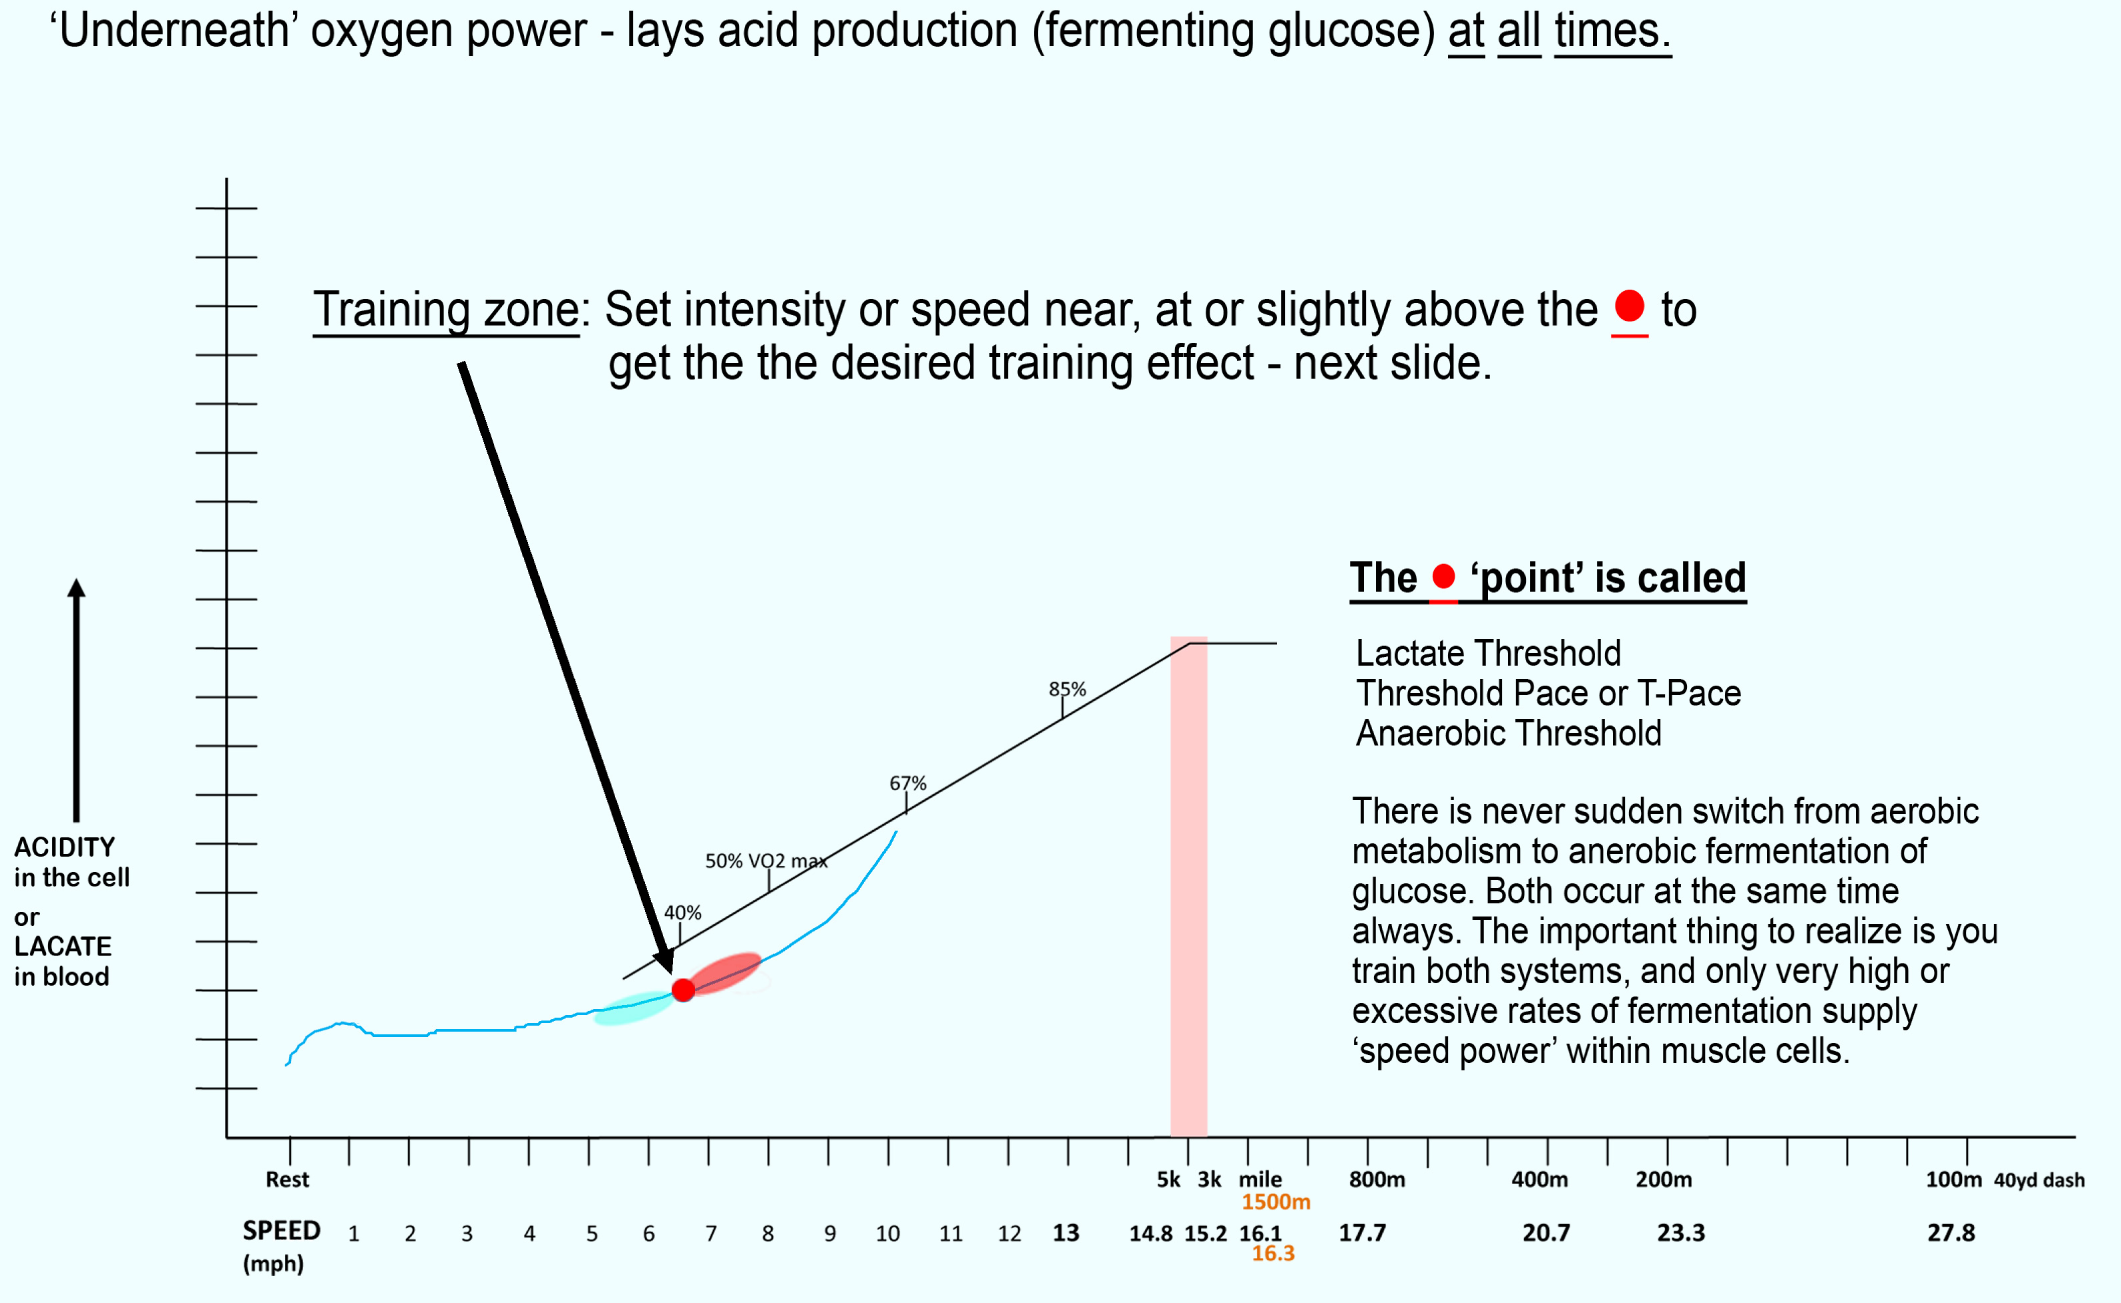
One must tap their aerobic potential more fully, by running at a greater percentage or fraction of their VO2 max, as shown in the next 2 graphs below.
First Image: Athlete 1 has a higher lactate threshold compared to athlete 2 – and doesn’t hit it until he’s running almost 8mph at 70% of his VO2 max.
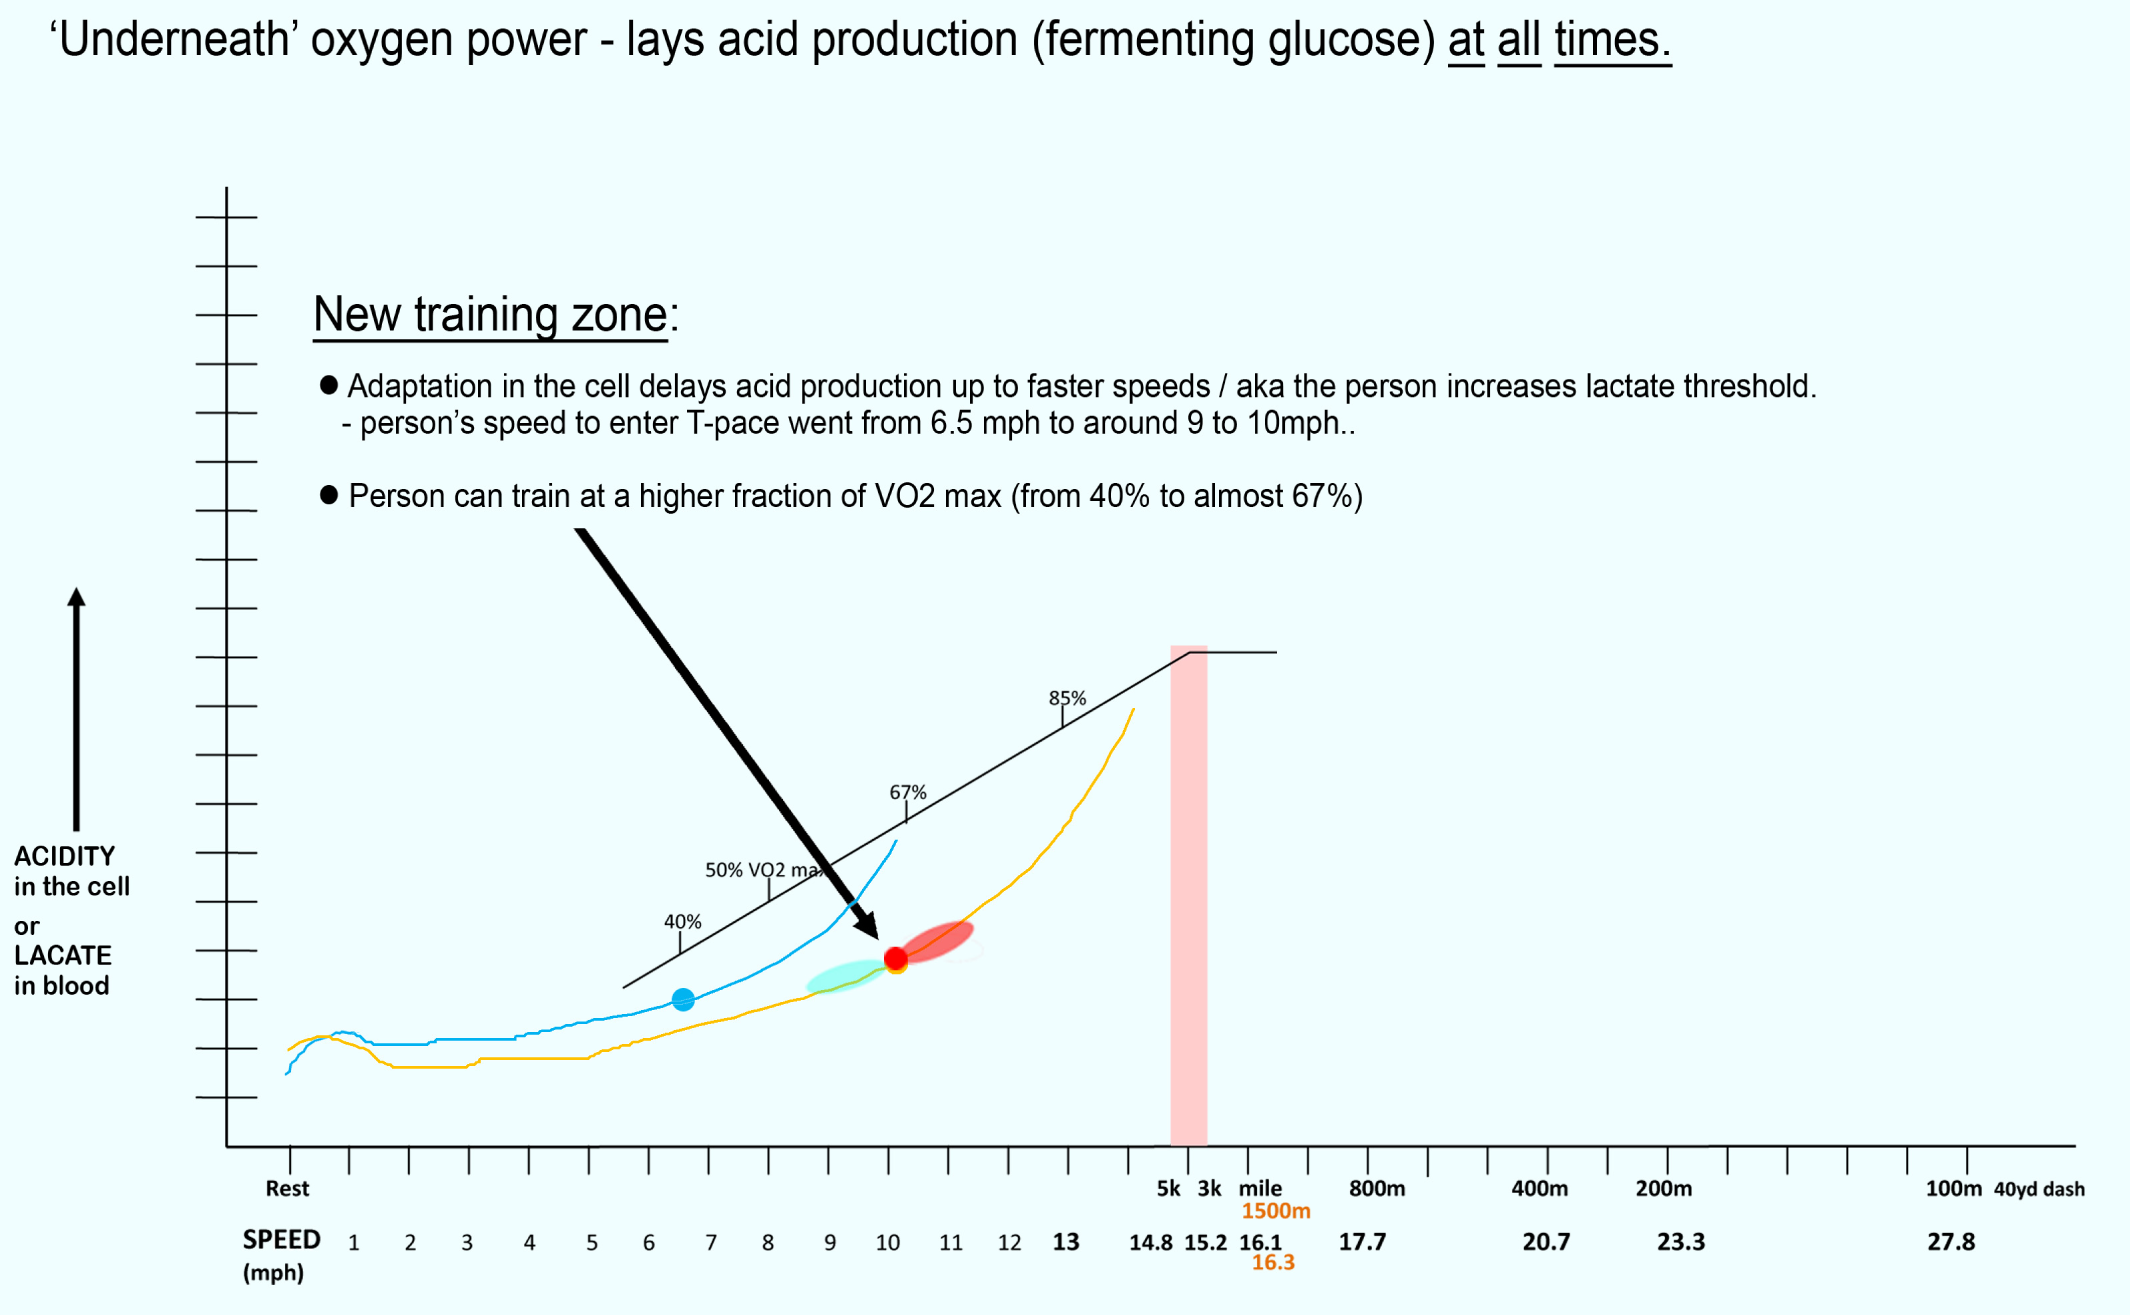
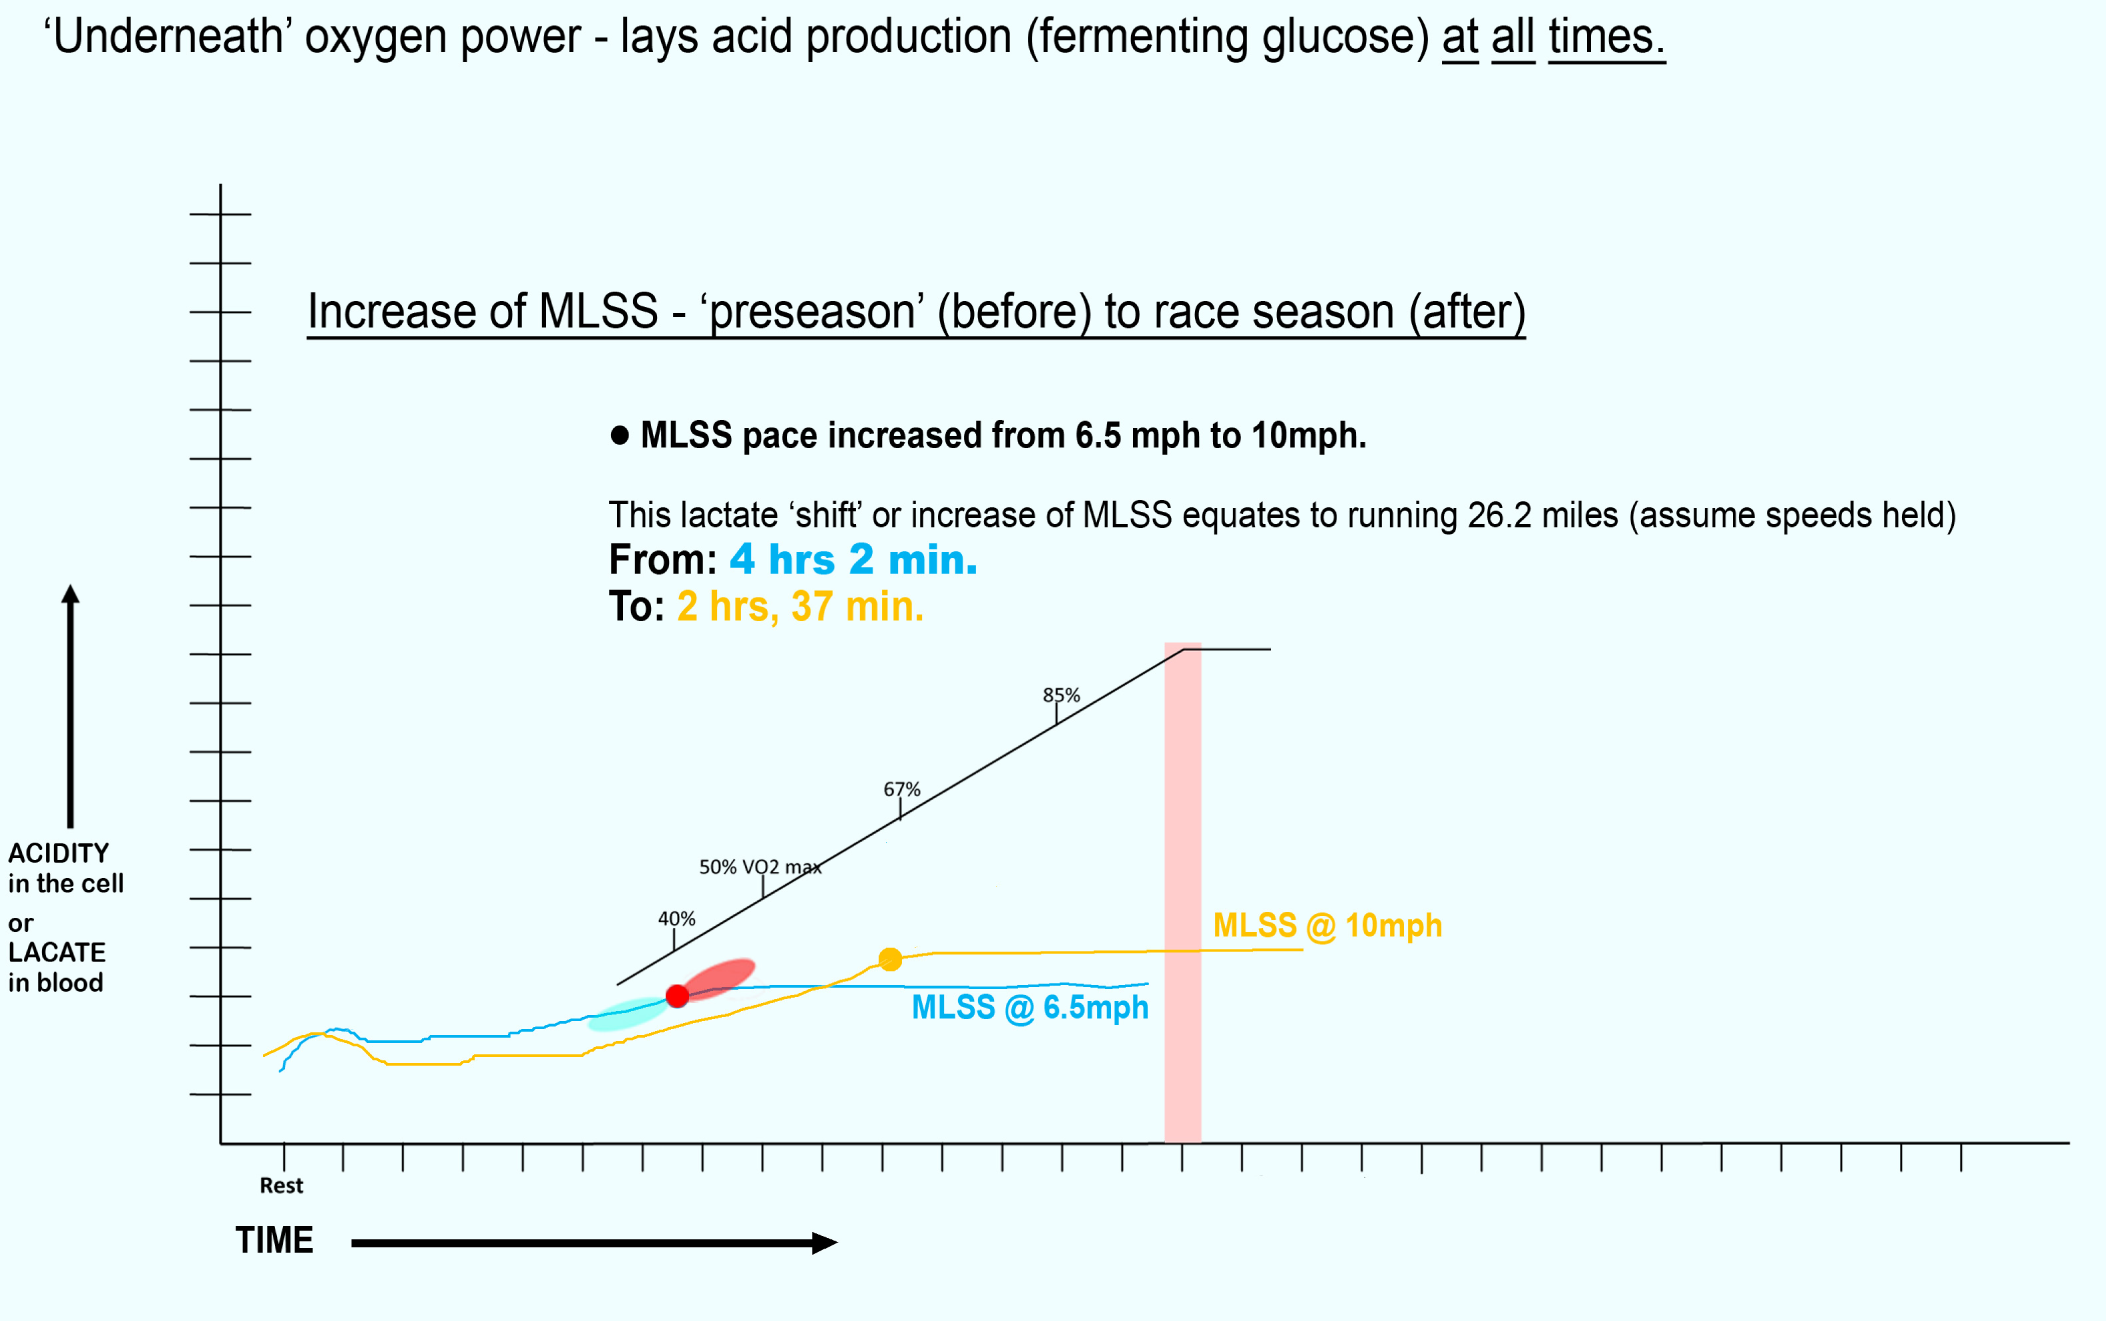
Second Image: Assumes only one of two athletes with identical VO2 maxes trains for 6 months after both take a long time off from training.
After ‘Dude’ trains and increases his lactate threshold – he now uses 65% of his aerobic capacity compared to 40% before training.
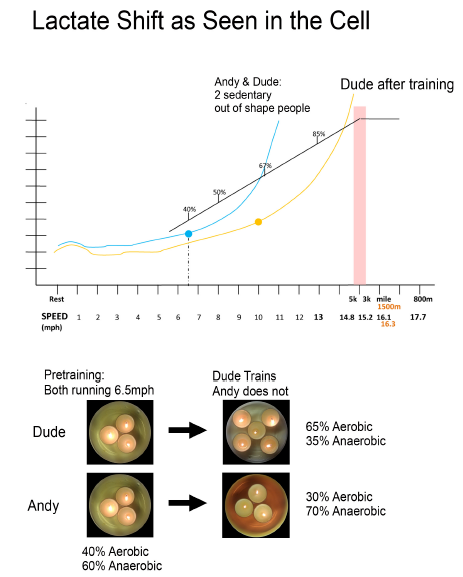
The blue line shows the lactate production and threshold point of BOTH runners before one begins training. Both hit lactate threshold running at 40% VO2 max – at 6.5 mph – reflected by the same amount of glycolysis in the cytosol, food-colored water. ‘Dude’ … after training hits lactate threshold running 10 mph – shown by the gold line as the ‘lactate shift’. He is now tapping into 65% of his VO2 max. Notice his mitochondrial density has increased, indicated by the additional candles. The purpose of training near, at, or slightly above lactate threshold ‘starves’ the cell of the oxygen it needs to produce power aerobically, and this stimulates: 1) mitochondrial growth; 2) increased capillary network; 3) increased blood volume, which is synonymous with capillaries added.
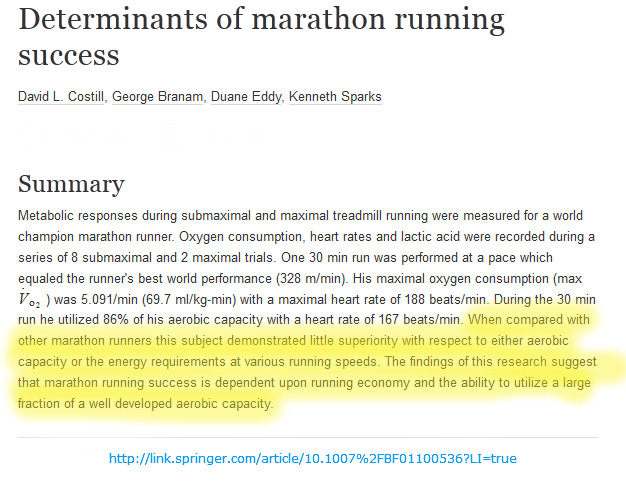
3. Due to differences in lactate thresholds, we see why greater VO2 maxes in champion marathoners does not predict faster race times.
Notice the runners with the lowest VO2 maxes ran faster personal best times than runners with higher VO2 maxes.

4. A series of VO2 graphs to give you greater perspective on the relationship between speed and VO2 max.


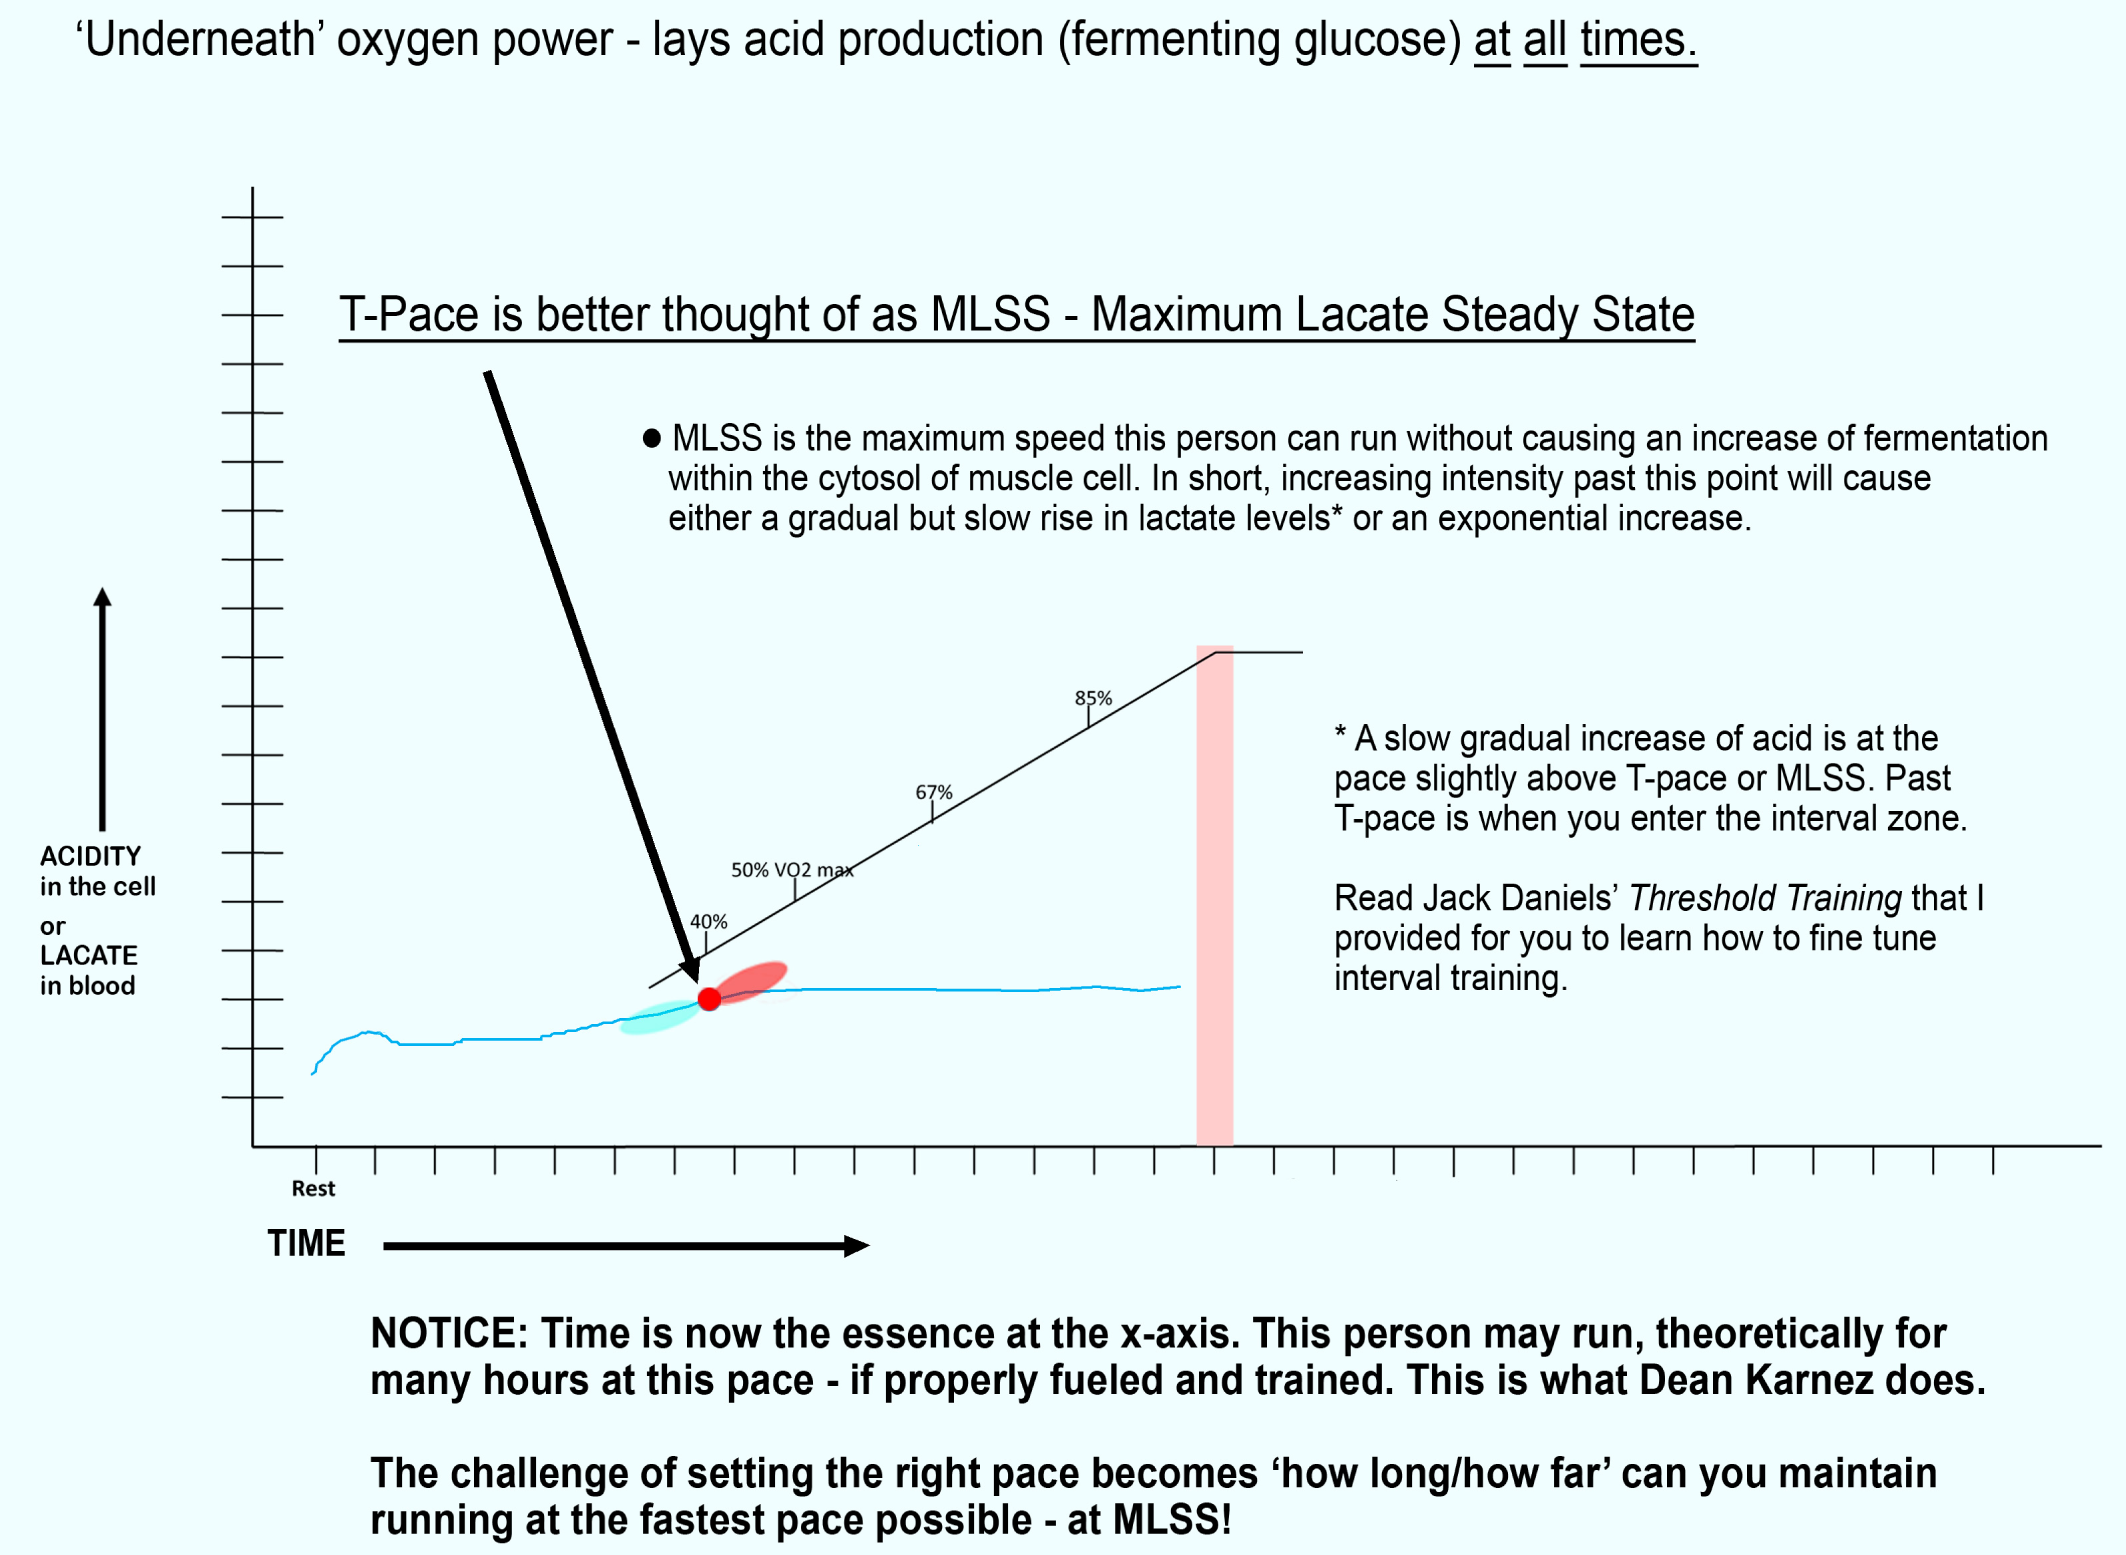
5. Practical application and perspective on lactate threshold and pace setting to run faster and avoid damage.
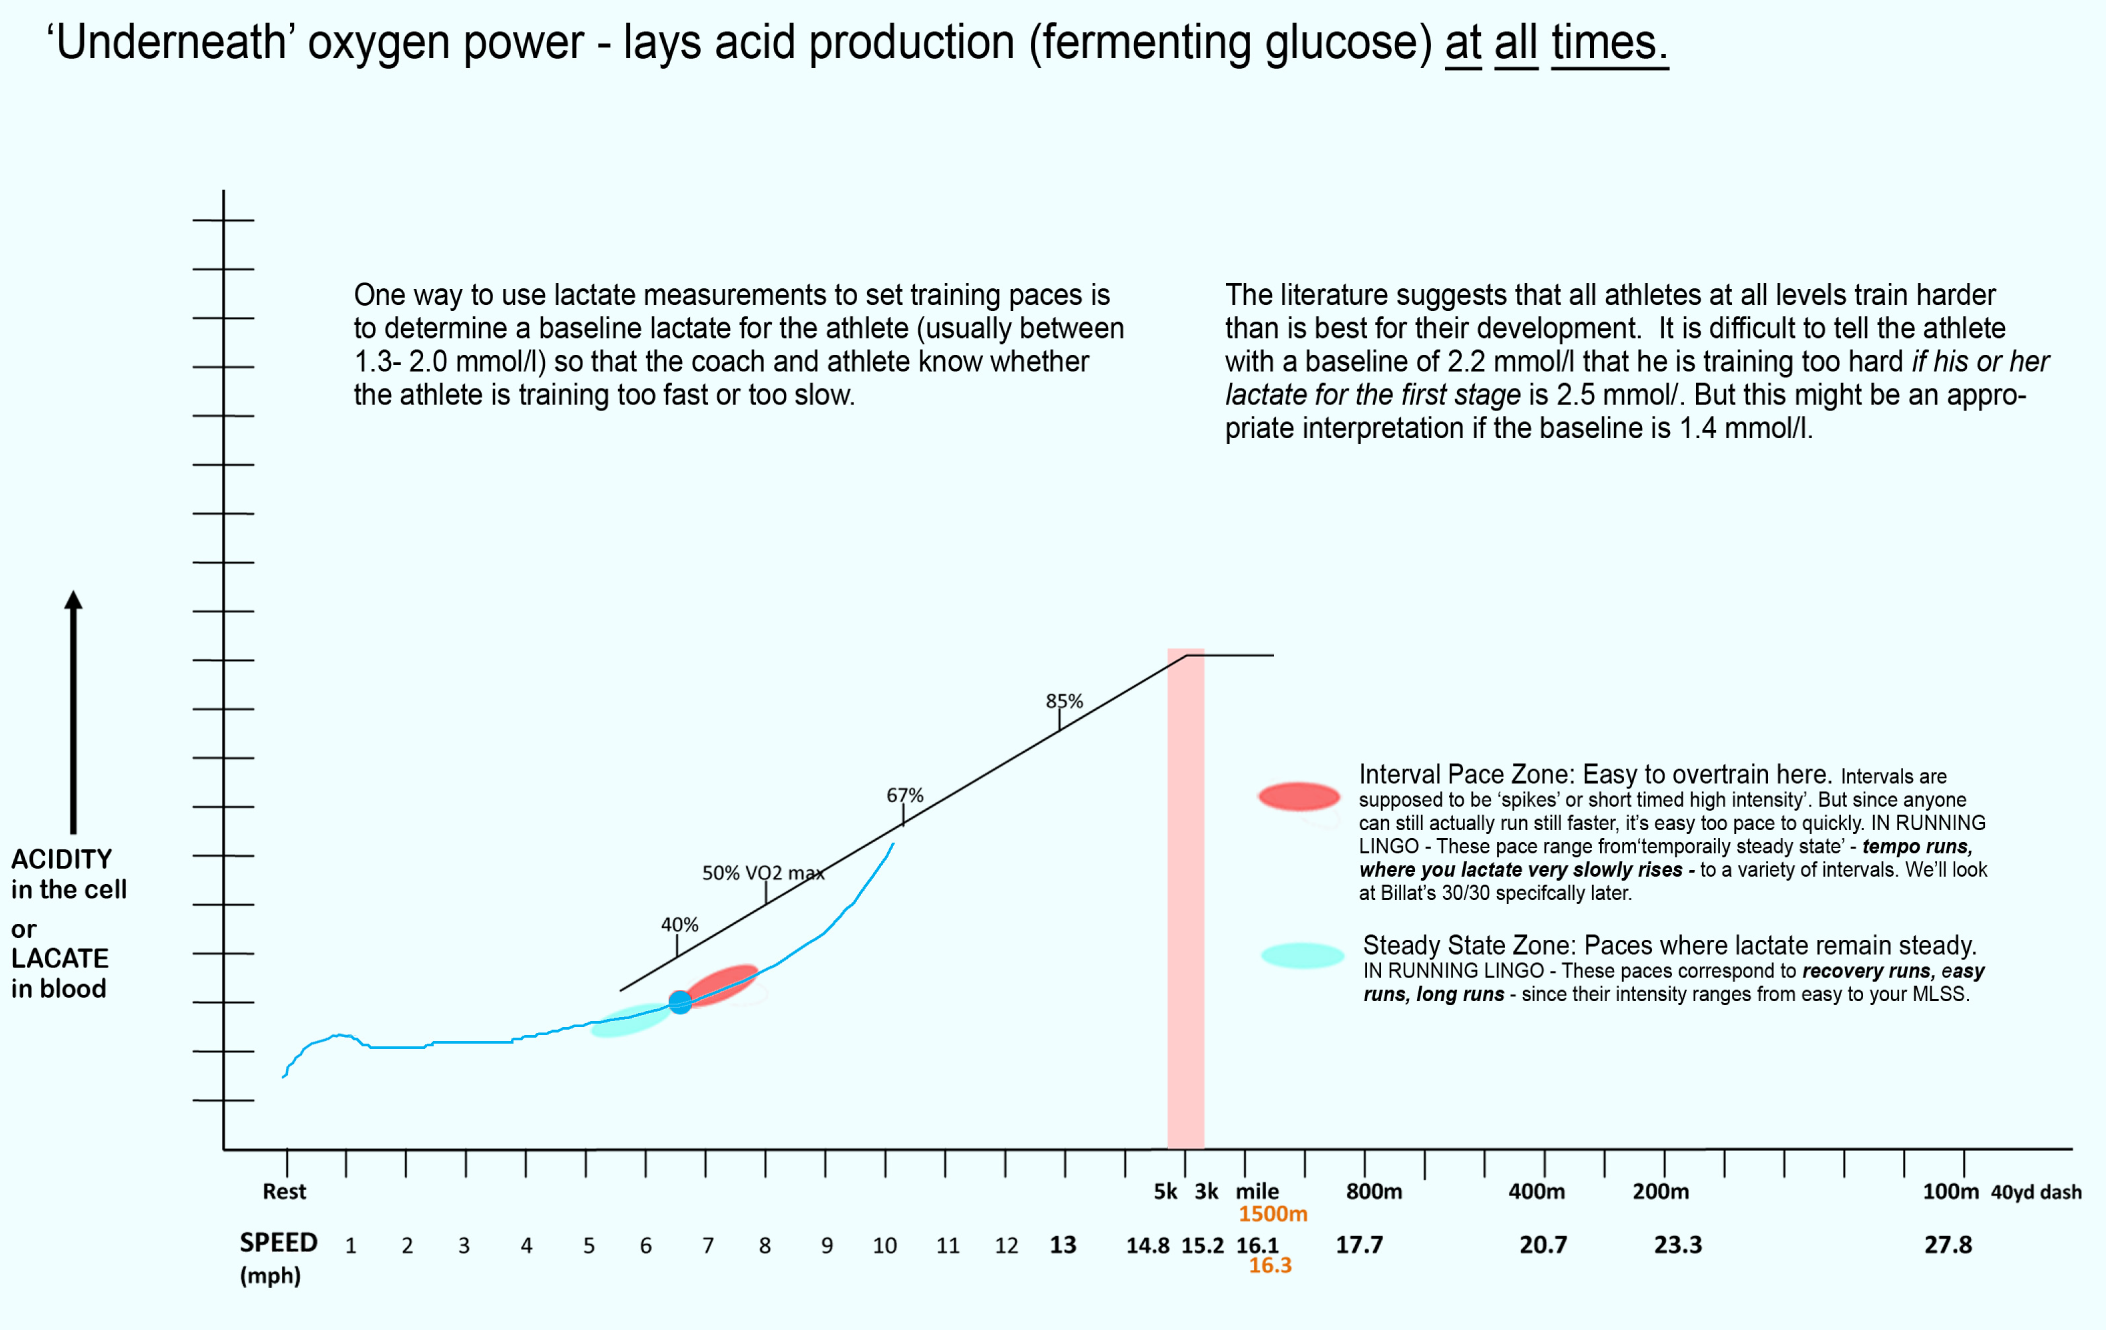
Read the following to learn more:
Threshold Training: Finding your T-pace
Remember, all it takes to perform a VO2 max test is to run, NOT as fast as possible, but past your lactate threshold, a bit faster and faster until your oxygen utilization maxes out.
Chronically training past your lactate threshold is easy to do with endurance training and causes structural damage to the mitochondria, which hinders performance. (As written by the South African Rowing Coaches)
Although weight training involves using muscles well past lactate threshold, it doesn’t involve using or stressing out the mitochondria.
Because interval training and resistance training are of short duration you use mainly stored ATP and extreme glycolysis within the cytsol to produce power, you are not forcing the mitochondria over miles and miles of distance, year after year to produce power, which wear and tears on the engine.
D) Demonstration: Direct Measurement of O2 Removed from Blood
Props needed:
1 Mason jar 20 small marbles or beads 100ml water in a tiny jar. 1 cup-sized strainer.
Calculation of (a-v) O2 Difference: The moment freshly oxygenated blood exits your heart it has contains 20ml of oxygen gas dissolved per 100 ml wad of blood, regardless of your exercise intensity. The amount of oxygen removed from arterial blood increases with exercise intensity. We see less and less oxygen in the venous blood returned to the heart as a result. Assume we extract a wad of freshly oxygenated arterial blood (100ml) the moment it leaves your heart and compare the amount of oxygen remaining in an equal volume of extracted venous blood just before it returns to the heart.
At rest we measure 12 ml O2 in the wad of venous return blood.
Thus, 8ml of O2 was consumed. (20-8 = 12ml)
- a-v O2 diff = 8ml O2.
At max intensity we measure 4 ml O2 in the wad of venous return blood.
Thus 16ml of O2 was consumed. (20-16 = 4ml)
- a-v O2 diff = 4ml O2.
(a-v) O2 Difference illustrated here
Demonstration: Direct Measurement of O2 Removed from Blood During Exercise
Props needed:
1 Mason jar
20 small marbles or beads
100ml water in a tiny jar.
1 cup-sized strainer.
The moment freshly oxygenated blood exits your heart it has contains 20ml of oxygen gas dissolved per 100 ml wad of blood, regardless of your exercise intensity.
The amount of oxygen removed from arterial blood increases as exercise intensity continually increases from rest, thus see less and less oxygen in the venous blood returned to the heart.
By comparing the lesser amount of oxygen remaining in the venous blood just before it returns to the heart with an equal volume of arterial blood that left the heart, we know how much oxygen was consumed by the cells of your body.
At rest we measure 12 ml O2 in the wad of venous return blood.
Thus, 8ml of O2 was consumed. (20-8 = 12ml)
- a-v O2 diff = 8ml O2.
At max intensity we measure 4 ml O2 in the wad of venous return blood.
Thus 16ml of O2 was consumed. (20-16 = 4ml)
- a-v O2 diff = 4ml O2.